Copper remains a key industrial metal, often considered a barometer for global economic health. As industries move toward electrification and infrastructure upgrades, the demand for copper continues to surge. This post provides an in-depth look at copper price trends based on futures data, helping investors and businesses make informed decisions.
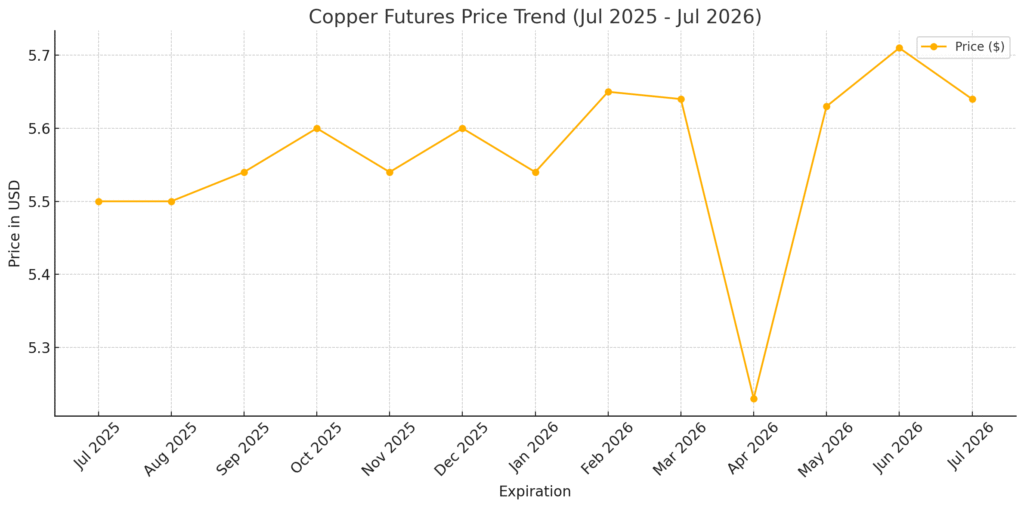
Figure: Copper Futures Price Trend from July 2025 to July 2026
Copper Futures Chain Data (2025–2026)
| SYM | Expiration | Price | Change | Percent Change |
| HGN25 | Jul 2025 | 5.5 | -0.14 | 2.53 |
| HGQ25 | Aug 2025 | 5.5 | -0.16 | 2.75 |
| HGU25 | Sep 2025 | 5.54 | -0.15 | 2.57 |
| HGV25 | Oct 2025 | 5.6 | -0.11 | 1.87 |
| HGX25 | Nov 2025 | 5.54 | -0.19 | 3.29 |
| HGZ25 | Dec 2025 | 5.6 | -0.15 | 2.67 |
| HGF26 | Jan 2026 | 5.54 | -0.24 | 4.07 |
| HGG26 | Feb 2026 | 5.65 | -0.15 | 2.6 |
| HGH26 | Mar 2026 | 5.64 | -0.18 | 3.04 |
| HGJ26 | Apr 2026 | 5.23 | -0.6 | 10.32 |
| HGK26 | May 2026 | 5.63 | -0.21 | 3.64 |
| HGM26 | Jun 2026 | 5.71 | -0.14 | 2.43 |
| HGN26 | Jul 2026 | 5.64 | -0.22 | 3.79 |


